Week 9
Design:
This week I have made a few versions of data visualizations for our next round of user testing. Since we want to have better presentations showing the character's spending and income, we will perform a user test on the original version of data visualization and the second version of data visualization.


Development:
This week I refined the code of front-end scrolling function. Before I used trigger point to detect if the point is hitting the top of the window to trigger the next plot, I found there are many bugs because detecting if an element reaches the top is more complex and it is not stable so if the user wants to scroll up it will cause some issues. Therefore I used a variable: when the user is scrolling down, the variable will increase. When the user is scrolling up, the variable will decrease. When that variable reaches a certain value, the next plot will be triggered. I did the test by myself and I found this method is much stable and there is no bug so far.
I also organize the code by using function to group the section plot transition so the code is more clean and easier to see.
I also programmed the progress bar which indicate which plot the reader is reading.

Next week Plan: implement the data visualization part into front-end.
This week I have made a few versions of data visualizations for our next round of user testing. Since we want to have better presentations showing the character's spending and income, we will perform a user test on the original version of data visualization and the second version of data visualization.


Left: Previous Version Right: Refined Version
I am also working on the questions for user testing. We will be focusing on the data visualization and also want to receive feedback from our 355 professors for the visualizations. To make it more polished and increase the consistency overall, I have also refined and finished the visual design for the website. Next week, I will be focusing on the user testing and assist on the front-end development.
Development:
This week I refined the code of front-end scrolling function. Before I used trigger point to detect if the point is hitting the top of the window to trigger the next plot, I found there are many bugs because detecting if an element reaches the top is more complex and it is not stable so if the user wants to scroll up it will cause some issues. Therefore I used a variable: when the user is scrolling down, the variable will increase. When the user is scrolling up, the variable will decrease. When that variable reaches a certain value, the next plot will be triggered. I did the test by myself and I found this method is much stable and there is no bug so far.
I also organize the code by using function to group the section plot transition so the code is more clean and easier to see.
 |
The code on the left is new: detecting by the value of variable(number); using function to group the transition code
The code on the right is old: detecting by detecting if the element reaching the top (by using a plugin: Waypoint); writing a very long and duplicate code of transition for each if statement
|
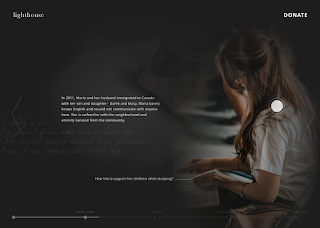
I also programmed the progress bar which indicate which plot the reader is reading.

 |
| When the user is scrolling down/up, the progress bar will indicate where the user is. Each small circle between Maria's Story and The Map represent a single plot, the user even can click the circle to jump to a different section of the story |

Comments
Post a Comment